
Comparative real costs of renewable options, before any subsidies
- Measuring by EROI
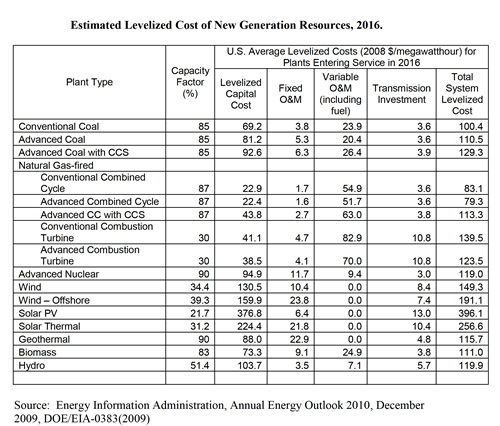
- Levelized cost data – from DOE's Energy Information Administration
Measuring by EROI: 'Energy Returned for Energy Expended'
NB: Longer bars are lower cost (higher energy returned).
Thanks to Mark Myles, Heaths Bridge Rd, for the iniative in compiling and presenting this graphic. Thanks to Cline Frasier for pointing us to EROI.
Levelized cost data - from DOE
Charted by Elliott Gue (The Energy Strategist)
All costs are in dollars per megawatt hour and assume the plant is to be completed and put into service in 2016.
The data source – DOE's Energyy Information Administration (EIA)
Excerpts from 'The Energy Strategist' writeup (emphasis added)
"A quick glance at the chart shows that both solar photovoltaic (PV) and solar thermal are expensive technologies, far more expensive than any other source of electricity listed. Wind power is a great deal more cost-competitive than solar ..."
"Solar and wind power plants are both extremely capital-intensive ..."
"... neither wind nor solar power is economic or cost-competitive with conventional energy sources without government support. One could argue that wind power comes close in certain markets with good wind resources, but that logic doesn’t work for solar energy."